
Most operators have the numbers they need scattered across a dozen reports and never find the time to connect them. Business Analysis does that connecting for you: it reads your bookings, revenue, capacity, guest reviews, and phone calls, then writes a plain-English analysis of how your business is doing and what to do about it. Every figure it cites comes straight from your own account, and it compares your current performance against your own trailing 12-month history rather than a generic industry average, so the read is grounded in how your activity, attraction, or experience actually runs. Use it to spot where you are leaving money on the table (empty midweek slots, under-priced peak times, revenue concentrated in one product) and to get a short, ranked list of concrete moves you can make this week. The analysis refreshes on its own each week, and you can rebuild it on demand for any date range.
In this article
Learn how to manage permission groups
How to open Business Analysis
Business Analysis lives in the top navigation bar. Open More Business Analysis, and TripWorks loads the analysis for the last 30 days. The page opens on the date range you last used and rebuilds automatically if the saved analysis is out of date. If you don't see Business Analysis in the More menu, either the beta feature isn't enabled for your account yet or you don't have the required permission (see the banners above).
What the Executive Summary tells you
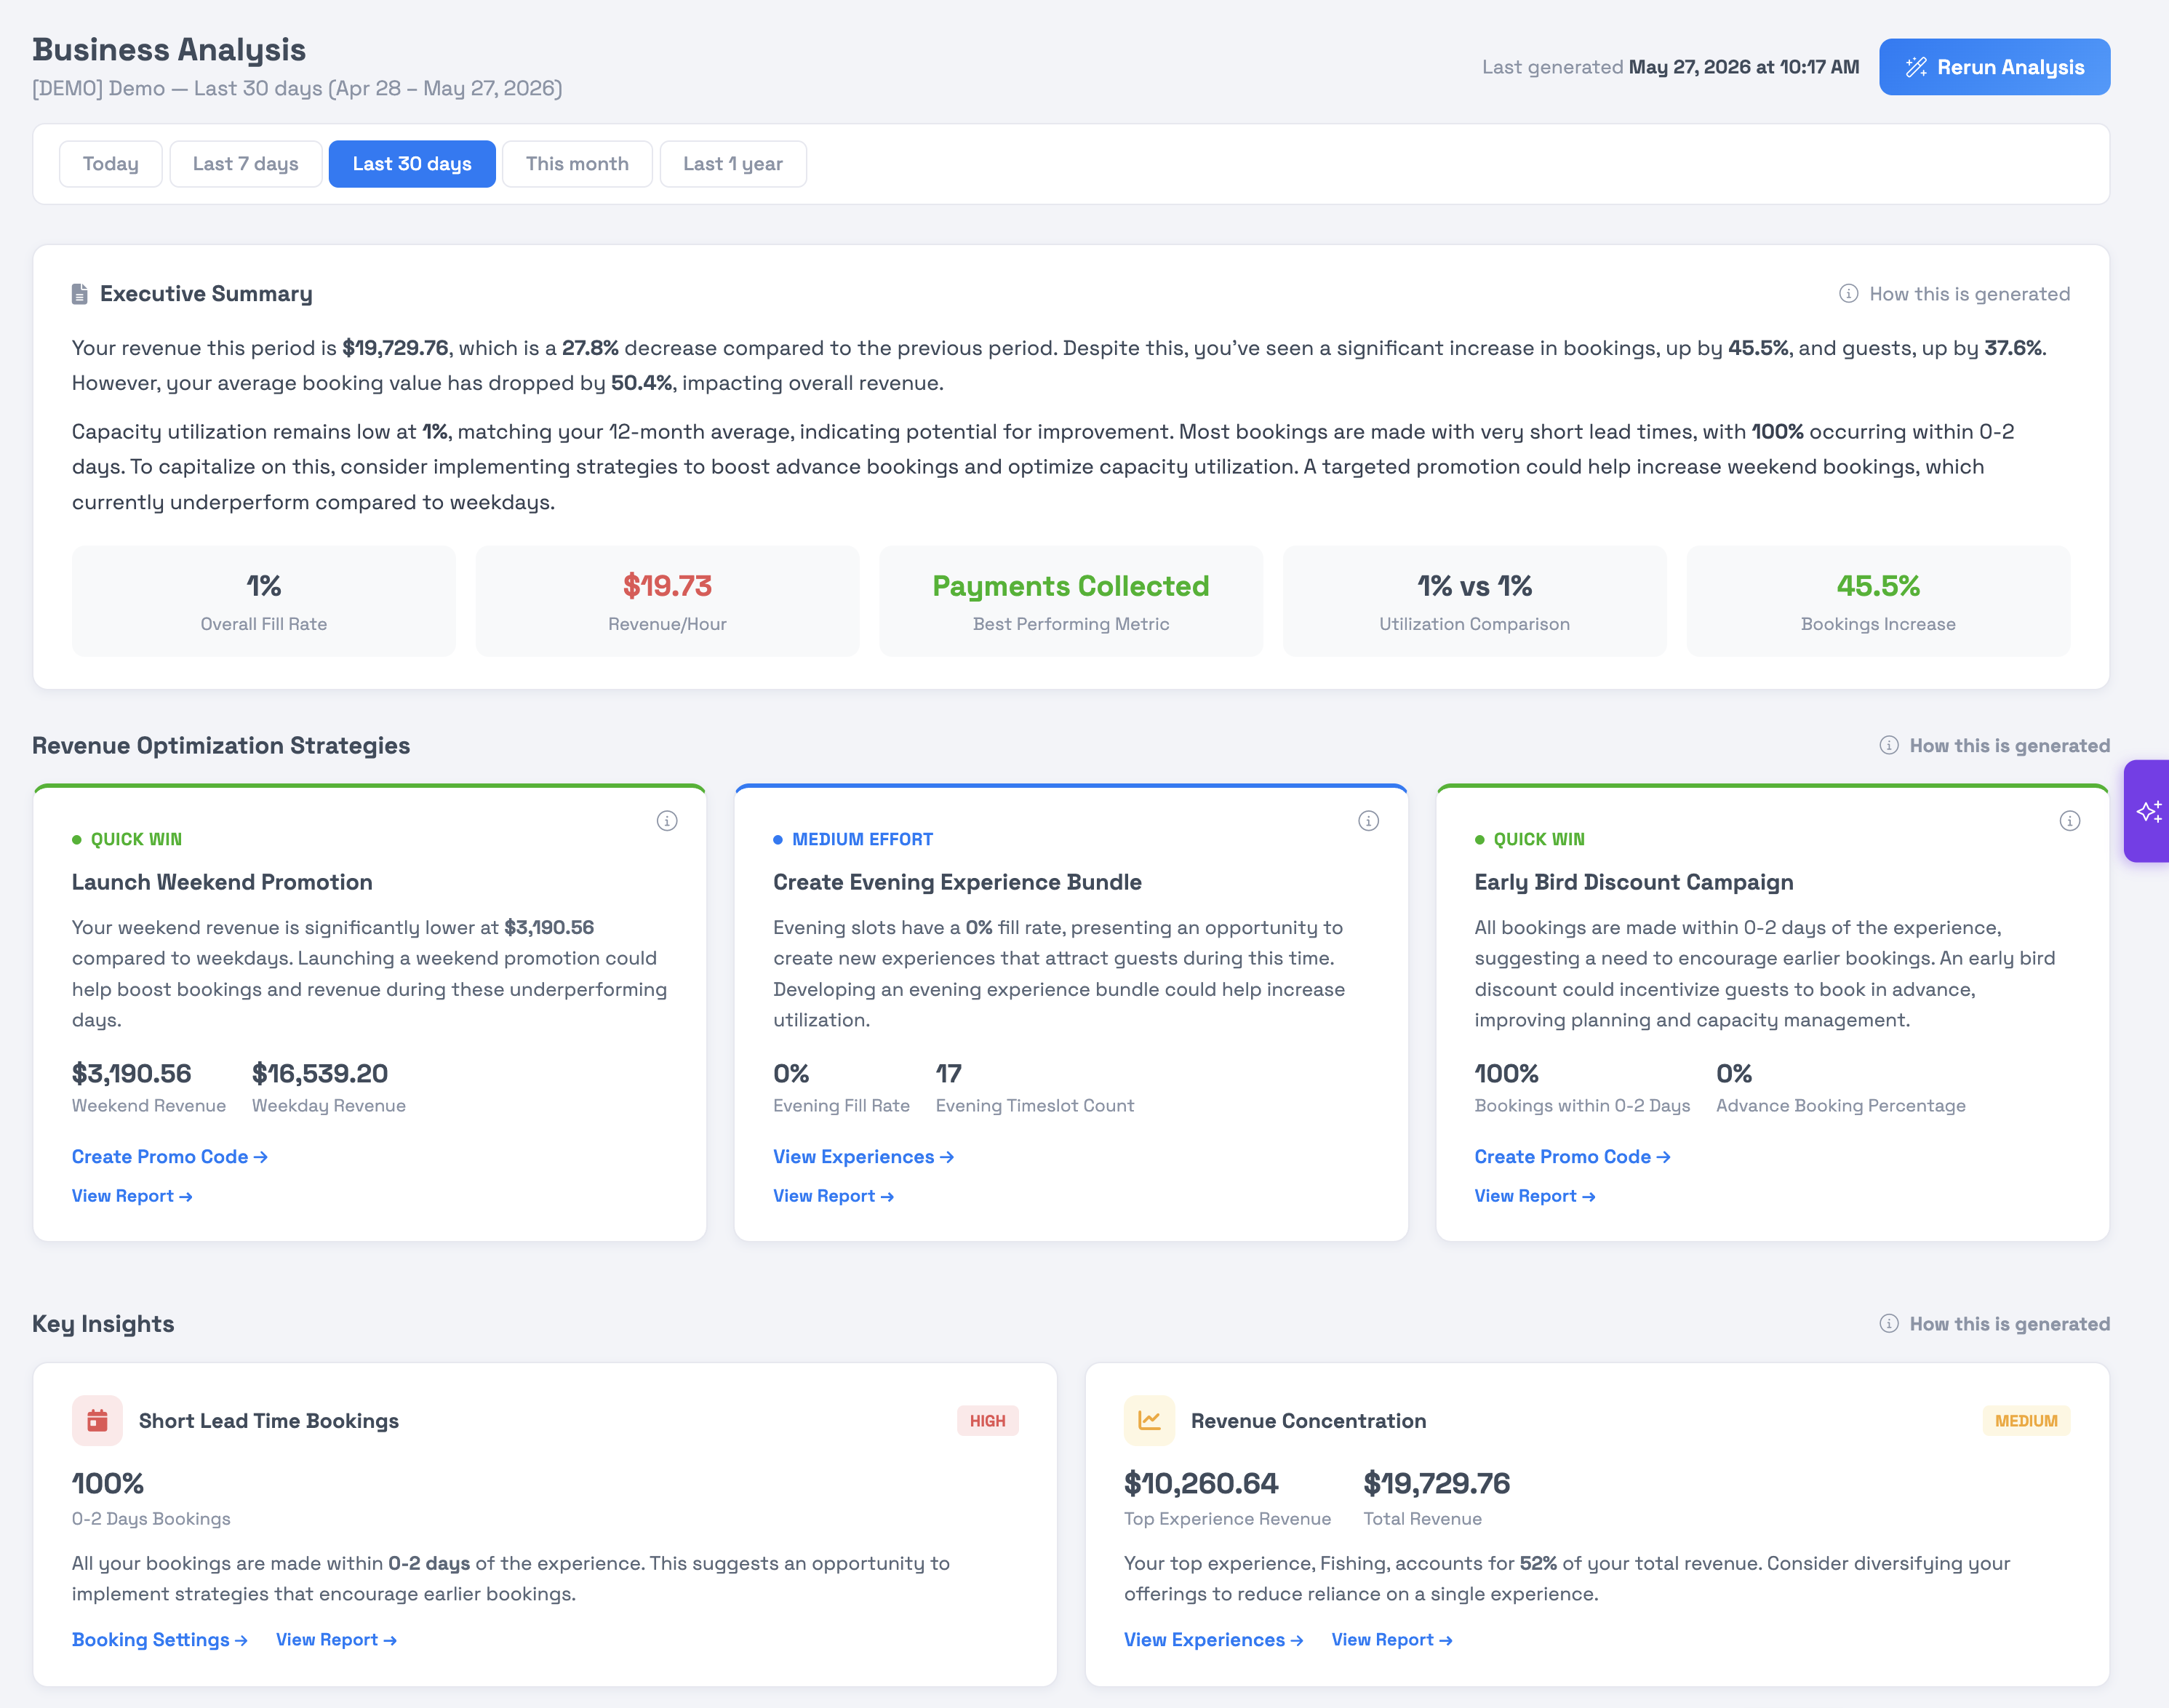
The Executive Summary at the top of the page is an AI-written overview of your performance for the selected date range. It reads your revenue, how full your time slots are, your guest ratings, and your booking patterns, then compares them against your own trailing 12-month history (or whatever history is available for a newer account). The result is a few short paragraphs in plain English, followed by a row of KPI pills that surface the specific numbers behind the write-up. These pills are chosen from what stands out in your data for the period, so which ones appear varies from account to account and period to period.
The baseline is always your own history, not an outside industry benchmark. A capacity figure of 62%, for example, is measured against how full you normally run, not against other operators.
Revenue Optimization Strategies
Below the summary, Revenue Optimization Strategies lists three recommended moves to grow revenue, each tagged by how much effort it takes:
| Tag | What it means |
|---|---|
| Quick Win | A change you can make now for a fast return, such as opening or repricing an under-booked time slot. |
| Medium Effort | A play that takes some setup, such as a promotion or a schedule change. |
| Strategic | A longer-term move, such as adding a product or shifting your pricing structure. |
Each strategy card explains the recommendation, shows the supporting numbers (such as estimated return), and gives an action link that takes you straight to the page in TripWorks where you'd make the change. TripWorks never applies these changes for you; the links just save you the hunt.
Key Insights
Key Insights are focused findings pulled directly from your bookings and time slots. Each card carries a priority badge and shows the exact figures behind it, such as your weekday-to-weekend revenue gap, how much of your business books last-minute, or how concentrated your revenue is in a single product. The numbers on these cards are exact, taken straight from your data; the short description and recommendation on each are AI-written to explain what the number means and what to consider next. Most cards include an action link to dig deeper in the relevant report.
Demand Pattern Analysis
The Demand Pattern Analysis section breaks down when and how guests book so you can match your schedule and pricing to real demand. All the figures come directly from your bookings; only the accompanying opportunity text is AI-written. It covers:
- Weekday vs Weekend Performance — revenue, booking count, and average booking value for weekdays compared with weekends.
- Booking Lead Time — how far ahead of the experience date guests book, shown as a distribution across lead-time buckets.
- Average Booking Value by Market Segment — Pre-Travel guests (who book 3 or more days ahead) versus In-Market guests (who book same-day or within 2 days while already in your area), so you can see which segment spends more.
- Time of Day Demand Patterns — utilization by morning, mid-day, afternoon, and evening, where utilization is seats booked divided by total capacity for that window.
Call Intelligence
If you've connected a phone system to TripWorks, a Call Intelligence section appears with an analysis of your inbound calls: Call-Driven Revenue, a Call Disposition breakdown of what callers needed, and Top Call Topics drawn from AI analysis of call transcripts. If no phone system is connected, this section prompts you to connect one and is otherwise hidden.
Choosing a date range and rerunning the analysis
Use the date-range buttons near the top of the page to change the period the whole analysis covers: Today, Last 7 days, Last 30 days (the default), This month, or Last 1 year. Changing the range reloads every section for that window.
The analysis refreshes on its own about once a week. To rebuild it immediately with your latest data, select Rerun Analysis in the top-right corner. A "Last generated" timestamp shows when the current analysis was produced.
Business Analysis is a guide, not a guarantee. The exact figures are pulled from your account, but the strategies and written commentary are AI-generated estimates based on your own historical patterns and may not be perfectly accurate. Review each recommendation with your own judgment before acting on it. TripWorks never changes your account, pricing, or schedule automatically.
For the full set of standard reports, see the Reports overview. For a quick daily pulse, see the Daily Executive Summary report.
Frequently asked questions
How often does Business Analysis update?
What does it compare my numbers against?
Are the numbers accurate, or are they estimates?
Why can't one of my team members see Business Analysis?
Can I change the time period the analysis covers?
Does Business Analysis make changes to my account?
What do Pre-Travel and In-Market mean in the demand patterns?
Why don't I see the Call Intelligence section?
Related
Built for attractions, tours & activities
An analyst for your business, built in
See how attractions, tours, and activities grow with TripWorks' AI insights. Book a demo and make the switch.